Investing can feel overwhelming with fluctuating markets, daily ups and downs, and confusing return metrics. That’s where CAGR (Compound Annual Growth Rate) steps in as one of the most powerful and beginner-friendly tools.
It cuts through the noise and tells you exactly how fast your money has grown on average every year, assuming steady compounding.
Whether you’re tracking stocks, mutual funds, business revenue, or even your own portfolio, CAGR gives a single, clean number that makes comparisons easy.
In this comprehensive guide, we’ll break down everything: what CAGR really means, its formula, step-by-step calculations, Excel tricks, comparison with XIRR, pros and cons, and most importantly, how to use our free CAGR Calculator tool.
By the end, you’ll be able to evaluate any investment like a pro and make smarter financial decisions.
What is CAGR
CAGR (Compound Annual Growth Rate) is a financial metric used to measure the average annual growth rate of an investment over a specific period of time. It assumes that the investment grows at a steady rate every year and that profits are reinvested.
In simple terms, CAGR tells you how much an investment grows each year on average, even if the actual returns fluctuate from year to year.
For example, if an investment grows from $10,000 to $20,000 in 5 years, CAGR calculates the annual rate of return that would turn the initial value into the final value over that time period.
Because of this, CAGR is widely used to measure long-term investment performance.
Why is CAGR used in finance?
Investors use CAGR because it provides a simple and consistent way to evaluate investment performance over time.
Key reasons investors rely on CAGR include:
1. Compare Different Investments
CAGR allows investors to compare the performance of different investments such as stocks, funds, or businesses over the same time period.
2. Measure Long-Term Growth
It helps investors understand how quickly their investment is growing annually.
3. Smooth Out Market Volatility
Markets fluctuate year to year, but CAGR shows the average growth rate, making trends easier to understand.
4. Evaluate Portfolio Performance
Investors use CAGR to track the long-term growth of their portfolios and determine whether their strategy is working.
What Is CAGR Growth?
CAGR growth represents the consistent, compounded yearly growth your investment would have achieved if it grew at a steady rate every single year.
Imagine your money growing like a snowball rolling downhill — each year the base gets bigger and the growth compounds. CAGR is that constant “snowball speed” that takes you from start to finish.
How CAGR shows consistent growth It assumes the same growth rate every year, even if real markets zig-zag. This creates a smooth growth curve that is easy to understand and compare.
Difference between actual yearly returns vs average growth Real returns can be wildly different: +30% one year, -10% the next. The arithmetic average might say 10%, but that’s wrong because losses hurt more than gains help.
CAGR calculates the single rate that actually produces the final amount — it’s the geometric mean, not the arithmetic one.
Why CAGR smooths volatility It completely ignores the ups and downs in between and focuses only on the starting value, ending value, and number of years. This makes it perfect for long-term analysis where day-to-day noise doesn’t matter.

Where CAGR Is Used
CAGR is used across almost every investment vehicle because it standardizes performance measurement.
CAGR in the Stock Market
In the stock market, CAGR is the gold standard for measuring stock performance over multiple years. Instead of looking at yearly returns that swing wildly, investors use CAGR to see the real annualized return of a stock or index.
For example, if you bought a share at ₹10,000 and it is now ₹25,000 after 8 years, the CAGR tells you the exact yearly growth rate that compounded to this result. This number helps you answer: “Did this stock actually beat the market?”
Comparing companies becomes effortless with CAGR. Suppose Company A delivered 18% CAGR over 10 years while Company B delivered only 9%. Even if both had similar one-year spikes, Company A clearly created more wealth consistently.
Let’s look at real data. The S&P 500 (a benchmark for global stocks) has shown approximately 14.6% CAGR over the last 10 years and around 11% over the past 33 years. In India, the Nifty 50 has historically delivered 12–15% CAGR in good decades.
Professional investors use CAGR to:
- Compare tech giants like Apple or Reliance Industries against old-economy stocks.
- Decide whether to hold or sell underperforming stocks.
- Benchmark their portfolio against indices.
CAGR also helps calculate future projections. If a stock has grown at 15% CAGR for the last decade, many analysts assume a similar rate for valuation models (though past performance is not a guarantee).
One limitation in stocks is that CAGR doesn’t account for dividends unless you include total returns (price + dividends). Always use “total return CAGR” for accuracy.
In summary, for stock market investors in India or globally, mastering CAGR turns confusing price charts into clear, comparable growth stories. It helps you spot winners early and avoid value traps.
CAGR in Mutual Funds
Mutual fund investors often analyze the CAGR of a fund over 5, 10, or 15 years to determine whether it has delivered consistent returns.
Mutual funds are long-term vehicles, and mutual fund performance is almost always reported using CAGR. Whether it’s an equity fund, debt fund, or hybrid, fund houses publish 1-year, 3-year, 5-year, and 10-year CAGR figures.
Why? Because SIP and lump-sum investors need to know the real compounded return after years of market cycles. In volatile markets, CAGR may not show the exact return in such cases; it is better for go for XIRR.
Long-term returns shine through CAGR. A fund that shows 15% 10-year CAGR has effectively doubled money every 4.8 years (Rule of 72). Compare this with a fund showing only 8% — the difference over 15–20 years is massive due to compounding.
In India, top-performing large-cap funds like Nippon India Large Cap have delivered 15.36% 10-year CAGR. Many mid-cap and small-cap funds have crossed 20% CAGR in recent 5–7 year periods.
Equity mutual funds historically aim for 12–15% long-term CAGR, which comfortably beats inflation (6–7%) and fixed deposits (6–8%).
CAGR helps mutual fund investors:
- Compare schemes within the same category (e.g., two large-cap funds).
- Track whether the fund manager is delivering consistent alpha.
- Decide between lump-sum vs SIP (though SIP uses XIRR — more on that later).
When you see a fund advertisement saying “15.2% returns since inception,” it is almost always CAGR. This transparency helps retail investors in Ranchi, Mumbai, or anywhere in India make informed choices without getting fooled by short-term flashy numbers.
Always check CAGR across multiple time frames (3Y, 5Y, 10Y) because a fund that looks great in 3 years might have underperformed over 10 years.
CAGR in Business Growth
Companies use CAGR to measure revenue growth, profit growth, or market expansion over time.
Businesses use CAGR to track revenue growth and for company valuation. It shows how fast the top line (sales) or bottom line (profit) has expanded year after year.
Investors and analysts love revenue CAGR because it reveals sustainable growth without the noise of one-time events. A company growing revenue at 25% CAGR for 5 years is far more attractive than one that grew 50% in year 1 and then stagnated.
Company valuation models (DCF, multiples) heavily depend on projected CAGR. Higher historical CAGR justifies higher price-to-earnings ratios.
Real-world examples:
- Global giants like Amazon have shown double-digit revenue CAGR for decades, turning a small online bookstore into a trillion-dollar empire.
- In India, Reliance Industries has delivered strong revenue CAGR through diversification into retail, telecom, and energy.
- Tech companies like Apple have maintained 15–20%+ CAGR in services revenue after shifting focus from hardware.
Startups pitch to investors using “We grew at 40% CAGR last 3 years.” Banks use CAGR to assess loan repayment capacity based on projected business growth.
CAGR is also used for:
- Measuring employee count growth, customer base expansion, or EBITDA growth.
- Benchmarking against industry averages (e.g., Indian FMCG sector CAGR vs IT sector).
- Merger and acquisition decisions — acquirers look for targets with superior CAGR.
Limitation: CAGR assumes steady growth, so sudden acquisitions or divestments can distort the number. Smart analysts always read footnotes.
For Indian entrepreneurs and investors, tracking revenue CAGR alongside profit CAGR helps separate growing businesses from those just inflating prices. A 15%+ revenue CAGR over 5–7 years is considered excellent for most sectors in India.
CAGR Formula
Instead of calculating CAGR manually, you can use a CAGR calculator to quickly determine the annual growth rate of your investment.
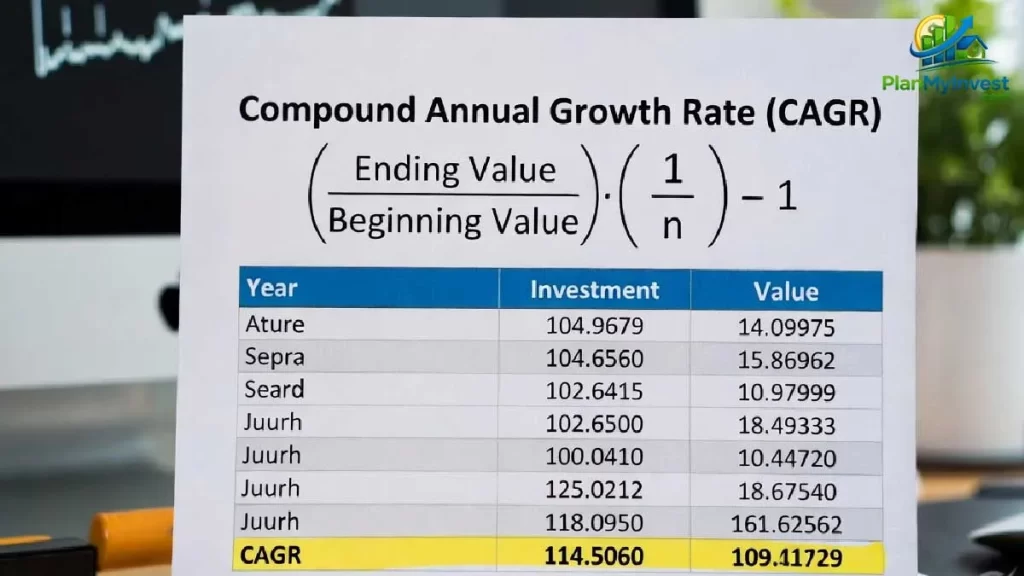
The official CAGR formula is: CAGR=(Initial ValueFinal Value)Years1−1
The calculator requires only three inputs:
- Initial investment value
- Final investment value
- Investment period (years)
Once you enter these values, the calculator instantly shows the compound annual growth rate of the investment. This helps investors quickly evaluate investment performance and long-term growth potential.
Component Meaning
- Initial Value: Starting investment amount
- Final Value: Ending value after the period (including all gains)
- Years: Number of years (can be fractional for months)
Simple explanation for beginners Suppose you invest ₹10,000 and it becomes ₹20,000 in 5 years. The formula says: take 2 (20k/10k), raise it to the power of 1/5 (0.2), subtract 1, and multiply by 100 for percentage. Result: ~14.87% CAGR. This means your money grew at almost 15% every year compounded.
How to Calculate CAGR (Step-by-Step)
- Step 1: Enter initial investment Example: ₹5,000 (or $5,000)
- Step 2: Enter final investment value Example: ₹12,000
- Step 3: Enter time period Example: 7 years
- Step 4: Apply formula or use calculator CAGR=(500012000)71−1≈0.133 or 13.3%
That’s it — you now know your money grew at 13.3% per year on average.
1. How to Calculate CAGR in Excel
Excel makes it effortless.
Excel formula example: = (Ending Value / Beginning Value) ^ (1 / Years) – 1
Example table:
| Initial Value | Final Value | Years | CAGR Formula | Result |
|---|---|---|---|---|
| 10000 | 20000 | 5 | =(B2/A2)^(1/C2)-1 | 14.87% |
Step-by-step in Excel:
- Type initial in cell A2, final in B2, years in C2.
- In D2 type the formula above.
- Format as percentage.
- For multiple investments, drag the formula down.
Pro tip: Use =RATE(Years, 0, -Initial, Final) for the same result.
2. Using CAGR Calculator
Several onlie platforms like Cleartax, Groww and other individual bank bodies provides you a free access to CAGR calculaer where you can calucalate the CAGR value for your investment. But, most of them lack the basic feature like doenlaoding the result ion PDF.
Our free online CAGR Calculator is designed to give instant results without spreadsheets.
How it works: Inputs:
- Initial Value
- Final Value
- Investment Period (years + months)
Result: Annual growth rate % + total growth % + doubling time (Rule of 72)
Just enter the three numbers and click “Calculate.” The tool instantly shows the CAGR, equivalent monthly rate, and a simple growth chart. Once done, you can download CAGR report as PDF as well.
Related tools you might like:
- Compound Interest Calculator
- SIP Calculator (uses XIRR)
- Future Value Calculator
- Inflation Adjusted Return Calculator
Bookmark our CAGR Calculator and use it every time you review your portfolio.
CAGR vs XIRR-What is the difference?
CAGR and XIRR are both annualized return measures but serve different purposes.
Comparison table:
| Feature | CAGR | XIRR |
|---|---|---|
| Investments | Single investment | Multiple cash flows |
| Time interval | Fixed | Fixed |
| Usage | Simple growth, lump-sum | SIP investments, staggered inflows/outflows |
| Calculation | Only start & end value | Considers exact dates of every transaction |
For better understanding and side by side comparison visit CAGR vs XIRR where and how to use them.
Why SIP investors often use XIRR
SIP involves monthly investments at different NAVs and dates. CAGR would ignore the timing and give wrong results. XIRR accounts for every rupee invested on its exact date, giving the true personal return.
In India, almost every mutual fund app shows XIRR for your SIP portfolio. Use CAGR only for lump-sum investments held without additional purchases.
Advantages of CAGR
Simple investment comparison across different time periods.
- Smooths market volatility for clear long-term view.
- Easy to understand even for beginners.
- Widely used metric by professionals worldwide.
- Helps in realistic future projections using compounding
Besides these advantage CAGR comes with some limitaions as well.
Limitations of CAGR
- Assumes constant growth rate (real markets fluctuate).
- Ignores market volatility and intermediate cash flows.
- Does not account for additional investments or withdrawals.
- Can be misleading for very short periods Does not consider risk or inflation.
CAGR-FAQs
What is a good CAGR rate?
For stocks and equity mutual funds, 10–15% is considered good in India. Large-cap funds around 12–15%, mid/small-cap can go higher (18–25% in strong periods). Anything consistently above 15% over 10+ years is excellent.
Can CAGR be negative?
Yes. If your final value is less than initial, CAGR will be negative, indicating loss of purchasing power.
Is CAGR better than ROI?
Yes for periods longer than one year. ROI is simple and doesn’t account for compounding or time. CAGR is the accurate multi-year version.
How accurate is CAGR?
Very accurate for lump-sum investments with no additional cash flows. It becomes less relevant when you add or withdraw money regularly (use XIRR then).
Why do investors use CAGR?
It allows apples-to-apples comparison, removes volatility noise, and shows the true power of compounding.
Does CAGR consider dividends or interest?
Only if you include them in the Final Value (total return basis).
Can I use CAGR for SIP?
Technically no — use XIRR instead for accuracy.
How is CAGR different from average return?
Average return is arithmetic; CAGR is geometric and always lower (or equal) because it accounts for compounding effect.
Conclusion
Understanding CAGR means you now speak the same language as professional investors. It shows what your money actually earned every year on average, smooths out market ups and downs, and helps you compare any investment fairly.
Whether you track stocks, mutual funds, or business revenue, CAGR is your go-to metric for long-term success.
Ready to check your own investments? Open our CAGR Calculator right now, plug in your numbers, and discover your true growth rate.
Understanding CAGR helps investors evaluate long-term investment performance and make smarter financial decisions. Start calculating today — your future wealth depends on it!
Happy investing!