CAGR shows the steady yearly growth rate that would turn your starting investment into the ending amount if returns are compounded smoothly every single year.
Indian investors love it because mutual fund fact sheets and advisor reports show a single clean percentage, making comparison easy. Yet this single number assumes constant growth and hides everything that actually happened along the way.
What is CAGR and why is it commonly used?
CAGR, or Compound Annual Growth Rate, measures the average annual growth of an investment assuming steady compounding over time, ignoring real-world fluctuations.
CAGR is widely used because it simplifies complex return patterns into a single percentage. Investors, fund managers, and analysts prefer it for quick comparisons between investments.
How do you actually calculate CAGR and what does the formula reveal?
You calculate CAGR by taking the ending value divided by the beginning value, raising it to the power of one divided by the number of years, subtracting one, and multiplying by 100.
The formula assumes no money was entered or left the investment during the period and that growth occurred at the same rate each year.
This reveals why the number can feel smooth even when your statement showed big losses one year and big gains the next.
The math looks like this:
CAGR=(Beginning ValueEnding Value)n1−1
It gives a clean, easy-to-understand number. But that simplicity is also where the problem begins. You can also use an online CAGR calculator to make the calculations.
Why CAGR can be misleading in real-world investing?
CAGR is misleading because it assumes smooth growth, ignoring volatility, interim losses, and real cash flows, which creates an unrealistic picture of investment performance.
In reality, markets don’t grow in straight lines. Prices fluctuate daily, sometimes dramatically.

Let’s say an investment goes:
- Year 1: +50%
- Year 2: -30%
CAGR might show a modest positive return. But the investor actually experienced a rollercoaster.
This “smoothing effect” hides risk.
CAGR gives a false sense of security because it erases volatility and presents every investment as if it grew steadily.
In the Indian market, where equity funds routinely swing 30 to 50 percent in a single year, this smoothing hides the stomach-churning drops that actually happened.
You see a respectable 18 percent CAGR and assume the ride was comfortable when it was anything but.
CAGR is useful, but it can also make returns look smoother than they really are. It works well for simple lump-sum investments, yet it can hide volatility, ignore cash flow timing, and make uneven performance look more consistent than it actually was.
How does CAGR hide volatility and risk?
CAGR hides volatility by averaging returns into a single steady rate, masking sharp ups and downs that significantly affect investor experience and risk exposure.
Ignoring volatility makes CAGR misleading in real Indian markets
Ignoring volatility makes CAGR misleading because Indian equity markets experience sharp drawdowns and recoveries that the single smoothed number completely erases.
A fund can lose 40 percent in one bad year like 2020 and still post a decent ten-year CAGR if it recovers strongly later.
People end up thinking the investment was steady when their portfolio statement showed a heart-stopping drop.
Volatility is not just a technical term here. For anyone in Jamshedpur or any Tier-2 city saving for a child’s education or retirement, a 30 percent drop feels very real when you open the app.
CAGR pretends that drop never happened. It also fails to show sequence-of-returns risk.
If those big losses came early in your investing journey, the damage to final wealth is far worse than the same losses at the end, yet CAGR treats both periods the same.
What is the biggest mistake investors make with CAGR?
The biggest mistake is assuming CAGR equals actual yearly returns. It does not. CAGR is an annualized average, not a record of what happened each year.
That misunderstanding can lead to bad decisions. An investor may see a strong CAGR and assume the investment was stable, when in fact it may have had sharp declines along the way.
Another investor may avoid a good fund because one weak period lowered the headline CAGR, even though the fund’s process was sound.
The best fix is simple. Treat CAGR as a summary statistic, not a performance diary. Once you do that, the number becomes useful instead of misleading.
When should you avoid using CAGR?
Do not use CAGR when returns fluctuate heavily, when there are multiple investments or withdrawals, or when analyzing short-term or irregular cash flows.
Avoid CAGR in these scenarios:
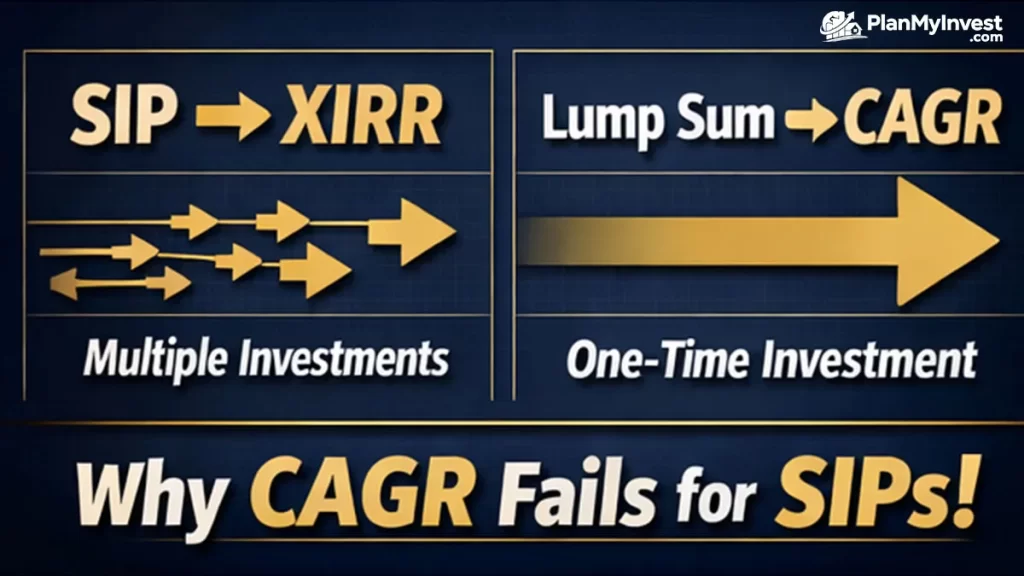
1. SIP or staggered investments
CAGR assumes a lump sum. SIPs involve multiple cash flows.
2. Portfolio with withdrawals
Real-life investing includes exits and rebalancing.
3. Highly volatile assets
Crypto, small caps, or startup investments.
4. Short-term analysis
CAGR becomes unreliable over short durations.
You should avoid using CAGR when the investment has multiple cash flows. SIPs, staggered investments, partial withdrawals, or irregular contributions make CAGR less reliable because it assumes one investment held continuously from start to finish.
CAGR is also weak for short time periods. A one-year or two-year CAGR can be distorted by a single strong quarter or a sudden market dip. The shorter the period, the more likely CAGR is to give a false sense of stability.
It is also not the best measure when you want to understand risk. CAGR tells you the growth rate, but it does not tell you how rough the ride was. If you care about drawdowns, volatility, or capital preservation, you need more than CAGR.
What better metrics should investors use instead of CAGR?
Instead of CAGR, use XIRR for any investment with cash flows, standard deviation and maximum drawdown to understand risk, and risk-adjusted measures like the Sharpe ratio to see if the returns were worth the volatility.
These give a far more honest picture of what actually happened to your money in Indian mutual funds and stocks.
XIRR calculation is the hero for most of us. It calculates the true compounded rate while respecting every SIP instalment. Standard deviation tells you how wild the yearly returns really were.
Maximum drawdown shows the worst peak-to-trough loss you would have lived through. Put them together and you get the full story that one CAGR number tried to hide.
How XIRR Fixes the Exact Problems CAGR Creates with SIPs?
XIRR fixes CAGR’s problems by considering the exact date and amount of every contribution or withdrawal.
For regular SIPs that most Indian investors run, XIRR gives the real personal rate of return instead of the smoothed fund-level number that ignores your buying schedule.
Try this with any fund you already own. Pull your statement, feed the dates and amounts into an XIRR calculator, and compare it to the fund’s advertised CAGR.
The difference is often eye-opening. In falling markets, your XIRR can actually be higher than CAGR because you bought more units cheaply.
In rising markets, the reverse can happen. Either way, you see your personal truth, not the fund’s polished average.
Why does CAGR mislead mutual fund investors?
CAGR fails for SIPs because it assumes a single investment, while SIPs involve multiple entries over time, requiring XIRR for accurate return calculation.

CAGR is often used in mutual fund marketing because it presents returns in a neat annualized form. That makes it easy to compare schemes at a glance, but it can also make a fund look more consistent than it really is.
This becomes a bigger problem when a fund had a strong recent rally. A fund that performed poorly for several years but surged later can still show a decent long-term CAGR.
If you invest monthly, each installment grows for a different duration.
CAGR ignores this completely.
That’s why platforms show:
- CAGR for lump sum
- XIRR for SIP
Using CAGR here can seriously mislead investors.
That does not necessarily mean it was a consistently good fund. It may simply have benefited from a favorable market phase.
Mutual fund investors also need to remember that fund-level CAGR is not the same as investor-level experience.
If the fund had volatile phases, changing allocations, or delayed entry points, the investor may not have earned the return suggested by the headline CAGR. That is why the context behind the number matters.
How is CAGR different from XIRR?
CAGR is best for a lump sum invested once and held through the full period. XIRR is better when money is invested or withdrawn at different times because it accounts for the exact timing of each cash flow.
That timing difference is why SIP investors should usually prefer XIRR. A SIP does not put all the money into the market on day one, so CAGR can overstate or distort the return experience.
CAGR vs XIRR: Key Differences, Formulas & When to Use
XIRR gives a more realistic view because it measures performance based on when each amount was actually invested.
The simplest rule is this. Use CAGR for one-time investments and XIRR for multiple transactions. That one distinction solves most of the confusion people have when they compare mutual fund returns.
How can you use CAGR without getting fooled?
CAGR is useful for comparing long-term investments with single lump sum inputs, especially when volatility and cash flow variations are minimal.
CAGR is not useless. It is just often misused.
Use it for:
- Comparing mutual funds (long-term)
- Benchmarking indices
- Evaluating steady investments
Avoid over-relying on it.
You can still use CAGR safely when comparing two lump-sum investments held for the exact same long period with no extra cash flows. Always pair it with volatility numbers and annual return tables.
Never use it alone for decision-making or future projections.
Treat CAGR like the headline on a newspaper. It grabs attention and gives you a quick sense of the story, but you still need to read the full article.
For Indian investors, that means checking the fund factsheet’s annual return table, the risk ratios, and your own XIRR.
Only then does the number become useful instead of misleading.
The safest approach is to use CAGR as a starting point, not a final answer. It is helpful for quick comparison, but it should never be the only thing you look at.
First, ask whether the investment was a lump sum or had multiple cash flows. If there were many entries or exits, switch to XIRR or another cash flow-aware measure.
Then check volatility, drawdowns, and benchmark performance to see whether the growth came with too much risk.
Second, look at the time period carefully. A five-year CAGR tells a different story than a one-year CAGR.
If the period is too short or too influenced by one market cycle, the number may not be dependable.
When is it Safe to Use CAGR (The Right Way)?
It is safe to use CAGR when you are comparing two lump sum investments over identical time periods, and you understand that it hides volatility.
For example, if you invested a one-time amount of Rs 1 lakh in HDFC Bank stock 5 years ago, and your friend invested Rs 1 lakh in ICICI Bank stock on the exact same day, comparing the 5-year CAGR is valid. It tells you which stock had a higher average growth rate.
CAGR is also useful for setting long term goals. If you need Rs 50 lakh in 10 years and you have Rs 20 lakh today, you can calculate the CAGR required to reach that goal.
This helps you decide if you need to save more or take more risk.
However, even in these cases, do not rely on CAGR alone. You must also look at the consistency of returns and the risk taken.
A high CAGR achieved with extreme volatility is not worth it for most investors.
The Securities and Exchange Board of India (SEBI) has tried to address the misuse of CAGR by asking mutual funds to display 10-year rolling returns prominently.
This is a step in the right direction.
What Are The Other Metrics You Look at Instead of CAGR?
Instead of relying on CAGR alone, you should look at Rolling Returns, XIRR (for SIPs), and risk-adjusted metrics like the Sharpe Ratio.
Rolling Returns
This is the best alternative for evaluating fund performance. Instead of one point-to-point number, rolling returns give you a range.
You can see the best 5-year return, the worst 5-year return, and the average. A fund with a narrow range between the best and worst is more consistent.
XIRR
As discussed, this is mandatory for SIP investors. It is the only metric that respects the time value of money for every single installment.
Sharpe Ratio
This measures how much return a fund generated for every unit of risk it took. A high CAGR with a low Sharpe Ratio means the fund took huge risks to get there.
Standard Deviation
This tells you how much the fund’s returns bounce around its average. A high standard deviation means a volatile fund.
A study by Value Research highlights that relying solely on CAGR can lead to false assumptions if there are drastic fluctuations in performance. You need a more holistic view.
If you are looking at a debt fund or a conservative hybrid fund, also look at the Sortino Ratio, which penalizes only downside volatility.
Footer Notes:
Frequently Asked Questions (FAQs)
Why does CAGR matter for Indian investors?
CAGR matters because it standardizes returns. It allows you to compare a 3-year fixed deposit with a 5-year mutual fund return on a yearly basis. But remember, it standardizes the math, not the risk.
Is XIRR always better than CAGR?
No. XIRR is better for irregular cash flows (SIPs). CAGR is better for simple, one-time investments. Use CAGR for comparing two different stocks you bought as a lump sum. Use XIRR for your monthly SIP portfolio.
Can CAGR be negative?
Yes. If the ending value is lower than the beginning value, the CAGR will be negative. This indicates a loss over the investment period.
Why do mutual fund apps show CAGR for my SIP?
Most apps show the fund’s CAGR (point-to-point return of the scheme) because it is easier to calculate and display. It is a regulatory requirement for fund factsheets. You have to manually calculate XIRR to see your personal return.
Does CAGR include dividend payouts?
Yes, usually. When calculating CAGR for mutual funds, the assumption is that all dividends are reinvested back into the fund. This is called the growth option or dividend reinvestment.
Is higher CAGR always better?
Not always. A higher CAGR may come with much higher volatility, deeper drawdowns, or more risk. A slightly lower but steadier CAGR can be better for many investors.
Can CAGR hide risk?
Yes. CAGR hides the ups and downs between the start and end values. That is why it can make a volatile investment look smoother than it really was.
Is CAGR useful for comparing stocks versus mutual funds?
It works reasonably for lump-sum stock purchases held long term, but mutual funds with ongoing SIPs need XIRR. Stocks also have dividends and corporate actions that pure CAGR ignores unless you adjust manually.
Final Words:
CAGR is a powerful tool, but it is not a truth serum. It smooths out the bumps in the road. It ignores the timing of your cash flows. It can be manipulated by choosing specific start and end dates.
If you want a better investment decision, combine CAGR with XIRR, volatility, benchmark comparison, and drawdown analysis. That gives you a clearer picture of both return and risk.
Related: